About IdentiFly
IdentiFly is a software for semiautomated classification based on geometric morphometrics. Primarily it was developed for identification of insect species but it can be used for classification of any objects which differ in shape. Moreover, IdentiFly can be used as an alternative to tpsDig for digitizing landmarks in two dimensions. At the moment it is used mainly for identification of honey bee subspecies and lineages .
Installation
- Download the ZIP file: IdentiFly1_8.zip
- Unpack the ZIP file and copy IdentiFly1_8 directory to your hard drive.
- Run the IdentiFly.exe
Recent changes
- Version 1.8: identification of honey bees from SE Morocco
- Version 1.7: identification of honey bees from SE Morocco
- Version 1.6: identification of Apis mellifera carpatica subpopulations
- Version 1.5: measurement of distance, more zoom options
- Version 1.4: identification of Apis mellifera carpatica
- Version 1.3: identification of Apis mellifera ruttneri
Graphical user interface
Apart from usual menu, toolbar and status bar there is a space in central part of the window where an image can be displayed using Open option. In order to add landmarks the image should be clicked while IdentiFly is in the Add mode. On the other hand the landmarks can be deleted and moved when the software is in the Select mode or the Drag mode. The landmarks can be moved using drag-and-drop method. The landmarks are displayed as numbered red crosses. The crosses can be surrounded by black or red circle. Red circle indicates that the landmark was selected and can be deleted or moved. A landmark can be selected by clicking it (in Select mode or Drag mode) or by clicking next to it and dragging a rectangle around it (only in Select mode). More than one landmark can be selected by clicking them while the Ctrl key is pressed down (in Select mode or Drag mode) or by clicking next to the landmarks and dragging a rectangle around them (only in Select mode). In Add mode selection of landmarks is not possible.
Landmark
Landmark is a point corresponding to particular part of an object depicted in the image. It is described by its x and y coordinates. Usually in one image there is a group of landmarks which form a configuration. Each landmark is associated with a number which is unique within one image.
Configuration
Configuration of landmarks is a group of landmarks used to measure an object displayed in one image. The configuration is described by the list of x and y coordinates of the landmarks. The landmarks within one configuration are numbered consecutively starting with one. Two or more configurations are comparable when they consist of the same number of landmarks and when the landmarks with the same number correspond to the same part of the analyzed objects.
Prototype
In IdentiFly software prototype is an image containing a configuration of landmarks. The prototype can be used as a reference for manual placing landmarks in new image. In this case the prototype should be displayed (using View prototype) in separate window next to the main window. Moreover, the prototype is a source of information about shape and size of the configuration used by options Reset landmarks and Fit landmarks.
Format DW.PNG
Data about landmarks and other information are stored together with image in files with extension ".dw.png". It is safe to view the DW.PNG images in other software, however, their editing in other software most likely will destroy the additional information. The landmark data can be read from an image even if the extension is .png. However, it is recommended to use full extenison (.dw.png) in order to provide information that some additional data is saved in the image which can be destroyed by editing in software which is not compatible. In order to view coordinates of the landmarks saved in . DW.PNG file you can either view data or export them in TPS, CSV or TXT format. Format TPS can be imported to TPS and MorphoJ software. Format CSV can be imported to Excel and other spreadsheet. Format TXT can be imported by MorphoJ and R software.
Menu
Menu
File Open Use this menu entry to open an image. At the moment it is possible to open following formats: *.png *.bmp *.tif *.jpg.
Open directory Use this menu entry to view all DW.PNG images from a directory. The files are sorted according to their file name and the first is displayed. To see the next image use Open next file . You can also go back using Open previous file .
Open next file This option is active only when Open directory or Outliers was used and when the currently displayed image is not the last in the list.
Open previous file This option is active only when Open directory or Outliers was used and when the currently displayed image is not the first in the list.
Save, Save as Use those menu entries to save landmarks or other modifications in DW.PNG file. Even if the original image was in JPG (or other) format it will be converted and saved in DW.PNG format.
Move to trash Use this menu entry to move the currently displayed image to directory "Trash". If directory "Trash" is not present it is created. This option is useful if you brows images in directory and decide that some of them are not suitable for measurements. The file is not removed permanently and it can be moved back to its original directory.
Import TPS Use this menu entry to import landmarks coordinates from TPS file and save it in DW.PNG image. In the same directory as the imported TPS file there should be image or images listed in the TPS file. The images will be converted to DW.PNG format. Only coordinates are imported, other information for example outlines are ignored.
Export, Export directory Use this menu entry to export the landmarks coordinates from the currently displayed image in TPS, CSV or TXT format. If you choose export directory all DW.PNG files from the directory will be exported.
Menu Mode There are three modes: Select mode, Drag mode and Add mode between which you can switch.
Select mode In this mode you can drag the mouse in order to select one or more landmarks. The selected landmarks can be moved using drag-and-drop method.
Drag mode In this mode you can drag the mouse in order to scroll within the image. Selecting and moving landmarks is also possible but the landmarks need to be selected one by one. Add mode In this mode you can add landmarks by clicking the currently open image. Selecting and moving landmarks is not possible in this mode.
Menu Edit
Flip image vertically Flip image horizontally Use those menu entries to obtain mirror image of the currently displayed image. You can flip the image either vertically or horizontally. Rotate Use this menu entry to rotate the currently displayed image 90 degrees clockwise.
Convert to grayscale Use this menu entry to convert the currently displayed image to grayscale.
Crop Use this menu entry to crop the largest dark object from the currently displayed image. User needs to adjust a threshold in such a way that the object of interest is black on white background.
Menu View
Data, Data from directory Use this menu entry to view coordinates of landmarks from the currently displayed image or from all DW.PNG images in the directory.
Zoom in Use this menu entry to increase the magnification of the currently displayed image.
Zoom out Use this menu entry to decrease the magnification of the currently displayed image.
Zoom to actual size Use this menu entry to change the magnification in such a way that one pixel in the image corresponds to one pixel in the screen.
Zoom landmarks Use this menu entry to change the magnification of the currently displayed image in such a way that all landmarks are visible.
Menu landmark Delete landmark Use this menu entry to delete selected landmarks. A selected landmark can be recognized by red circle around it. For more information see Graphical user interface
Reset Use this menu entry to show landmarks from the prototype file. The currently displayed landmarks will be removed.
Fit Use this menu entry to adjust the position of landmarks. The adjustments are based on the prototype file. Before fitting at least the first and the last landmark needs to be located by the user. The other landmarks should be outside of the image.
Outliers Use this menu entry to check for presence of outliers. This is possible only when there is large number of objects measured. A directory should be indicated where all the images are stored. Average configuration of landmarks is determined for the images. The image with configuration which differed most from the average configuration is displayed. The differences are marked with yellow lines. Other images from the same directory can be also displayed with the differences marked using open next image. The images are arranged from the most different to the least different from the average. This option can be used to detect errors in the measurements including: swapping landmarks incorrect position of some landmarks.
Menu Scale Set scale bar Use this menu entry to provide information about scale bar. Distance in meters corresponding to the scale bar should be provided. The last two landmarks are converted into a scale bar.
Clear scale bar Use this menu entry to remove information about scale bar.
Set resolution Use this menu entry to provide information about resolution of the image. Units of the resolution should be pixels per meter. For example if you take the image of a grid paper and 1 centimeter is represented in the image by 1000 pixels than resolution is 100 000 pixels per meter (which can be calculated as 1000 pixels divided by 0.01 meters). If a grid paper of scale bar is visible in the image you can use Set scale bar to determine the resolution of the image.
Set resolution to directory Use this menu entry to provide information about resolution to all images in a directory.
Scale information Use this menu entry to obtain information about scale bar and resolution.
Menu Classification
Set classification Use this menu entry to choose classification file. This file contain mainly information useful for identification, however, there is also information about prototype.
View prototype Use this menu entry to display a new window with prototype image. The window can be helpfull when you add or correct position of landmarks. You can zoom in and zoom out the image using Ctrl + up and Ctrl + down, respectively.
Classify Use this menu entry to classify an object displayed in the image as one of the groups covered by the classification file. The classification is based on the configuration of landmarks. The number of landmarks should be the same as in the prototype file. Results of the classification are displayed in a new window.
Classify directory Use this menu entry to classify objects represented by images from one directory as one of the groups covered by the classification file. The classification is based on average configuration calculated from all the images in the directory. This option can be useful when we classify a honey bee colony using a group of workers or when we classify a plant using measurements of several leaves.
Menu Help
About IdentiFly Use this menu entry to obtain basic information about IdentiFly. There is information about version and link to the website with help information.
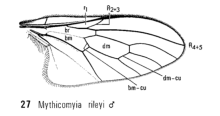
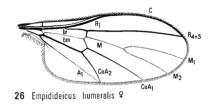
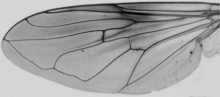
Use of IdentiFly for identification of honey bee lineages and subspecies In honey bee there is more than 20 subspecies (or geographic races) which were grouped into four evolutionary lineages. Before a honey bee colony can be classified as one of the evolutionary lineages you need to obtain forewing images of at least ten workers from the colony. The wing images from different colonies should be saved in separate directories. Each of the wings has to be measured. In case of honey bees 19 landmarks should be located in appropriate part of the wing. The landmarks should be placed in such a way that blue circles around them are tangent to the venation outline in at least three points. Position of the landmarks is essential for correct classification.

In order to locate landmarks please use appropriate mode: Mode -> Add landmarks. In this mode clicking the image will result in adding a landmark. It is recommended to zoom in the image and verify if the landmark is correctly placed. If needed the position of the landmark can be corrected. In order to correct the position of landmarks you need switch the mode: Mode -> Edit landmarks. In this mode a landmark can be dragged and dropped to a new position. After measurements the image file should be saved: File -> Save. Position of landmarks is saved within the file and can be later verified, corrected and exported. In case of honey bees there are several possible classification. In order to choose appropriate classification option Classification -> Set classification should be used. For identification of honey bee lineages choose file "classification_apis_mellifera_lineages.dw.xml". With each classification file there is associated a prototype file. It is an image containing information about number and position of the landmarks. In order to see the prototype option Classification -> View prototype can be used. Then the prototype is displayed and can be used as a reference for the correct position of the landmarks. When all wing images from one colony were measured the colony can be classified: Classification -> Classify directory, next you choose directory where the wing images were saved. It is also possible to classify a single wing (using option Classification -> Classify), however, this is not recommended because identification of honeybee lineages and subspecies based on single wing is very inaccurate. The classification information will be displayed in a new window. The most important is group to which the colony was assigned. For proper interpretation of the classification user should inspect also classification probability. The probability values can range from zero to one. The higher probability of assignment to particular group indicates high similarity of the classified colony to reference samples. In the best scenario the probability for one subspecies will be high and in all remaining subspecies very low. In this case the focal colony should be classified as the subspecies or lineage with the high classification probability. It is difficult to recommend a threshold value above which a classification probability should be considered as high. In another scenario classification probability is relatively high in two or more subspecies. In this case the focal colony should be considered as hybrid between the subspecies with high classification probabilities. Finally the classification probability can be low in all subspecies. In this case the classification of the focal colony as one of the subspecies should be concluded as doubtful. This can happen in two cases: when the focal colony is very different from all reference samples or when there is an error in measurements. The first case can occur when the colony belongs to species other than A. mellifera, for example A. cerana, or the colony belongs to subspecies not included in the classification model, for example, A. m. pomonella. This should not happen very often because the presented here classification covers most of the honey bee subspecies. Low classification probabilities in all subspecies most often occurs because there is an error in measurements. One of the most common errors is swapping position of two landmarks. In order to detect possible errors option Landmarks -> Outliers can be used. Then files from one folder are compared and the wings most different from the average are displayed. The differences of each landmark from the average are marked with yellow lines. There is also graphical representation of the identification. The colony is represented as a black point in CVA graph with subspecies or lineages marked as ellipses. The closer the point to the centre of the ellipse the higher similarity of the colony to the particular subspecies or lineage. The graph should be interpreted with care, particularly by users not familiar with multivariate statistical analysis. It is important to notice that in many cases there is more dimensions than the two presented in the graph and the proximity of a point to an ellipse can be misleading. Information about other canonical variates are presented in the table below graph. If the colony differs markedly from all subspecies the black marker can be invisible in the graph. As an example we present classification results of one colony collected in Cyprus. First we have used "classification_apis_mellifera_lineages.dw.xml" classification file.

The colony was classified as O lineage. The probability of classification to this group was 0.16 which is much higher than values for lineages A, C and M: 2.0x10⁻¹⁰, 1.1x10⁻⁸ and 1.5x10⁻¹⁷, respectively. In this case it is safe to conclude that the identified colony was from lineage O. In the graph showing CV1 and CV2 the black square representing the colony is within O ellipse. Next we have used "classification_apis_mellifera_subspecies.dw.xml" classification file.
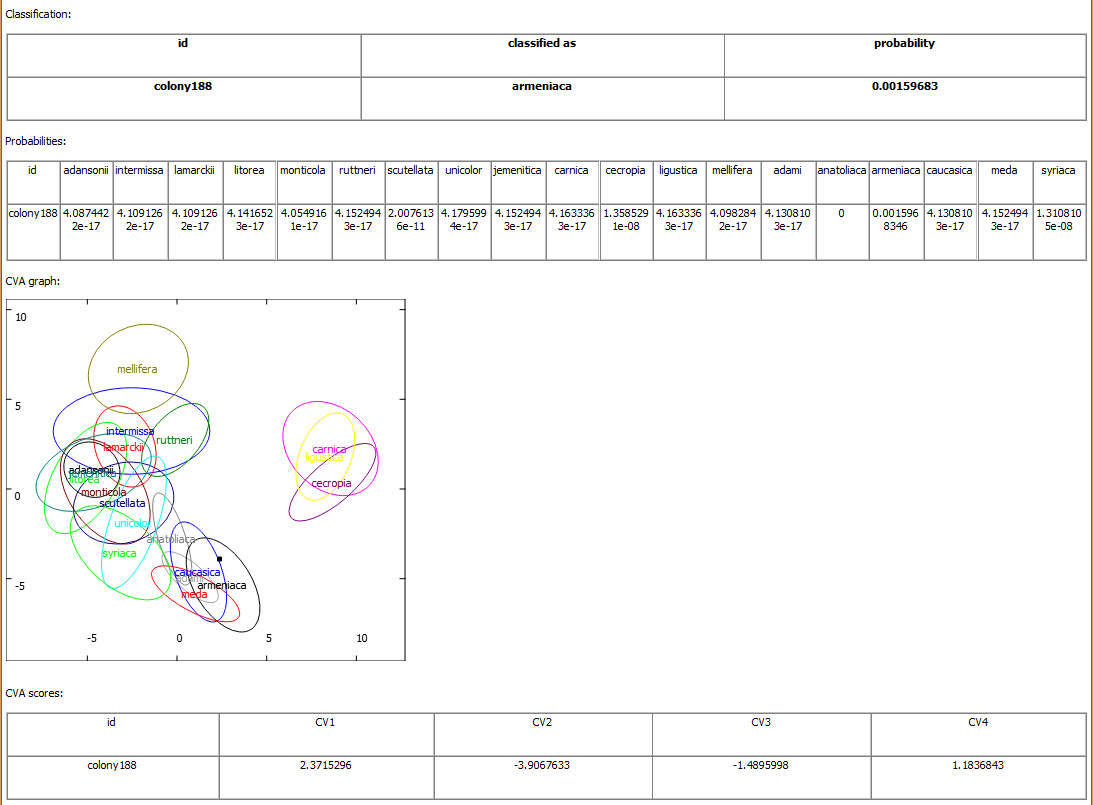
The same colony was classified as as A. m. armeniaca. The classification probability (8.5x10⁻⁴) is much lower than previously. The second highest probability (3.9x10⁻⁹) is for A. m. syriaca. In this case we should conclude that the identified colony is similar to A. m. armeniaca but markedly different from the reference sample of this subspecies and either it is hybrid with A. m. syriaca or it belongs to subspecies not covered by the identification model. We know that the later explanation is true because using other methods the colony was identified as A. m. cypria. The colony was correctly classified as belonging to lineage O. However, it could not be classified as A. m. cypria because this subspecies was not included in the classification model due to small sample size.